Nurses work hard and deserve to be paid well. Discover the top 10 states for nursing salaries, according to the latest data from the U.S. Bureau of Labor Statistics.
Are you ready to earn your online nursing degree?
Credit: Courtney Hale / Getty Images
[hen-ui-card variant=”background-white” border=”stroke”][hen-ui-flex direction=”column” gap=”lg”][hen-ui-heading variant=”h2″]Key Takeaways[/hen-ui-heading][hen-ui-list variant=”unordered” bullet-style=”check” marker-color=”secondary”] [hen-ui-list-item][hen-ui-text variant=”b4″]Alabama reports the lowest annual median salary for RNs at $65,900 in 2023.[/hen-ui-text][/hen-ui-list-item] [hen-ui-list-item][hen-ui-text variant=”b4″]Cost-of-living adjusted salaries place California nurses’ earnings at $119,102, the highest in the country.[/hen-ui-text][/hen-ui-list-item] [hen-ui-list-item][hen-ui-text variant=”b4″]Nurses can compare state salary and living-cost data to target high-paying regions or negotiate competitive pay aligned with local economics.[/hen-ui-text][/hen-ui-list-item][/hen-ui-list][/hen-ui-flex][/hen-ui-card][hen-ui-text variant=”b4″]Registered nurses (RNs) are dedicated professionals serving citizens across the lifespan. Beyond the satisfaction of doing such honorable work, nurses deserve to [hen-ui-link href=”https://nursejournal.org/registered-nursing/rn-salary/”]earn a salary[/hen-ui-link] equal to their knowledge, skill, and experience.[/hen-ui-text][hen-ui-text variant=”b4″]Keeping track of changes in national and local nurse salary data can help professionals make good career choices in terms of where to live and work. It may also provide insights to help you [hen-ui-link href=”https://nursejournal.org/ask-a-nurse/how-to-negotiate-a-higher-salary/”]negotiate higher pay[/hen-ui-link].[/hen-ui-text][hen-ui-text variant=”b4″]This article covers newly released data from the U.S. Bureau of Labor Statistics (BLS) as of May 2023. Read on to discover the latest nurse salary data and which states pay nurses the most.[/hen-ui-text]
[hen-ui-text variant=”b4″ class=”text-primary-900 font-heading font-bold text-xl”]What is the Average Nursing Salary in 2023?[/hen-ui-text][hen-ui-list variant=”unordered” bullet-style=”bullet”] [hen-ui-list-item][hen-ui-text variant=”b4″]The average annual RN salary is [hen-ui-text tag=”strong” weight=”bold”]$86,070[/hen-ui-text], or [hen-ui-text tag=”strong” weight=”bold”]$41.38[/hen-ui-text] an hour.[/hen-ui-text][/hen-ui-list-item] [hen-ui-list-item][hen-ui-text variant=”b4″]In the last year, the average annual RN salary increased by [hen-ui-text tag=”strong” weight=”bold”]6%[/hen-ui-text].[/hen-ui-text][/hen-ui-list-item] [hen-ui-list-item][hen-ui-text variant=”b4″]The average annual nurse practitioner (NP) salary is [hen-ui-text tag=”strong” weight=”bold”]$126,260[/hen-ui-text], or [hen-ui-text tag=”strong” weight=”bold”]$60.70[/hen-ui-text] an hour[/hen-ui-text][/hen-ui-list-item] [hen-ui-list-item][hen-ui-text variant=”b4″]In the last year, the average annual NP salary increased by [hen-ui-text tag=”strong” weight=”bold”]3.8%[/hen-ui-text][/hen-ui-text][/hen-ui-list-item][/hen-ui-list]
[hen-ui-text variant=”b4″ class=”text-right text-sm mb-8″ tag=”em”]Source: BLS, 2023[/hen-ui-text][hen-ui-flex gap=”xl” align=”left” direction=”column”][hen-ui-flex gap=”xs” align=”left” direction=”column”][hen-ui-heading variant=”h2″]Popular Online MSN Programs[/hen-ui-heading][hen-ui-text variant=”b4″ color=”subtext”]Learn about start dates, transferring credits, availability of financial aid, and more by contacting the universities below.[/hen-ui-text][/hen-ui-flex][hen-ui-dynamic-experience placement=”belowTheFold” /][/hen-ui-flex][hen-ui-heading variant=”h2″]Registered Nursing Salaries by State[/hen-ui-heading][hen-ui-text variant=”b4″]The interactive map below displays average annual RN salaries, according to the BLS. As you can see, [hen-ui-link href=”https://nursejournal.org/registered-nursing/rn-salary/”]RN salaries[/hen-ui-link] vary by state. You can also expect nurse salary differences between various metropolitan areas and facilities in the same city or neighborhood.[/hen-ui-text][hen-ui-text variant=”b4″]Using the map, hover over any state for more detailed information, including state ranking, median annual salary, and cost-of-living index score.[/hen-ui-text]
[hen-ui-table][hen-ui-table-caption]The Highest-Paying States for Registered Nurses[/hen-ui-table-caption][hen-ui-table-header][hen-ui-table-row][hen-ui-table-head scope=”col”]Rank[/hen-ui-table-head][hen-ui-table-head scope=”col”]State[/hen-ui-table-head][hen-ui-table-head scope=”col”]Median Annual Salary[/hen-ui-table-head][/hen-ui-table-row][/hen-ui-table-header][hen-ui-table-body][hen-ui-table-row][hen-ui-table-cell data-title=”Rank”]1[/hen-ui-table-cell][hen-ui-table-cell data-title=”State”]California[/hen-ui-table-cell][hen-ui-table-cell data-title=”Median Annual Salary”]$133,990[/hen-ui-table-cell][/hen-ui-table-row][hen-ui-table-row][hen-ui-table-cell data-title=”Rank”]2[/hen-ui-table-cell][hen-ui-table-cell data-title=”State”]Hawaii[/hen-ui-table-cell][hen-ui-table-cell data-title=”Median Annual Salary”]$129,210[/hen-ui-table-cell][/hen-ui-table-row][hen-ui-table-row][hen-ui-table-cell data-title=”Rank”]3[/hen-ui-table-cell][hen-ui-table-cell data-title=”State”]Oregon[/hen-ui-table-cell][hen-ui-table-cell data-title=”Median Annual Salary”]$110,940[/hen-ui-table-cell][/hen-ui-table-row][hen-ui-table-row][hen-ui-table-cell data-title=”Rank”]4[/hen-ui-table-cell][hen-ui-table-cell data-title=”State”]Washington[/hen-ui-table-cell][hen-ui-table-cell data-title=”Median Annual Salary”]$107,720[/hen-ui-table-cell][/hen-ui-table-row][hen-ui-table-row][hen-ui-table-cell data-title=”Rank”]5[/hen-ui-table-cell][hen-ui-table-cell data-title=”State”]Alaska[/hen-ui-table-cell][hen-ui-table-cell data-title=”Median Annual Salary”]$106,410[/hen-ui-table-cell][/hen-ui-table-row][hen-ui-table-row][hen-ui-table-cell data-title=”Rank”]6[/hen-ui-table-cell][hen-ui-table-cell data-title=”State”]District of Columbia[/hen-ui-table-cell][hen-ui-table-cell data-title=”Median Annual Salary”]$105,220[/hen-ui-table-cell][/hen-ui-table-row][hen-ui-table-row][hen-ui-table-cell data-title=”Rank”]7[/hen-ui-table-cell][hen-ui-table-cell data-title=”State”]New York[/hen-ui-table-cell][hen-ui-table-cell data-title=”Median Annual Salary”]$104,570[/hen-ui-table-cell][/hen-ui-table-row][hen-ui-table-row][hen-ui-table-cell data-title=”Rank”]8[/hen-ui-table-cell][hen-ui-table-cell data-title=”State”]Connecticut[/hen-ui-table-cell][hen-ui-table-cell data-title=”Median Annual Salary”]$100,620[/hen-ui-table-cell][/hen-ui-table-row][hen-ui-table-row][hen-ui-table-cell data-title=”Rank”]9[/hen-ui-table-cell][hen-ui-table-cell data-title=”State”]New Jersey[/hen-ui-table-cell][hen-ui-table-cell data-title=”Median Annual Salary”]$100,160[/hen-ui-table-cell][/hen-ui-table-row][hen-ui-table-row][hen-ui-table-cell data-title=”Rank”]10[/hen-ui-table-cell][hen-ui-table-cell data-title=”State”]Massachusetts[/hen-ui-table-cell][hen-ui-table-cell data-title=”Median Annual Salary”]$99,730[/hen-ui-table-cell][/hen-ui-table-row][/hen-ui-table-body][/hen-ui-table]Source: BLS, May 2023[hen-ui-text variant=”b4″]According to newly released salary data, the [hen-ui-text tag=”strong” weight=”bold”]highest-paying states[/hen-ui-text] for RNs are:[/hen-ui-text][hen-ui-list variant=”unordered” bullet-style=”bullet”] [hen-ui-list-item][hen-ui-text variant=”b4″]California [hen-ui-text tag=”strong” weight=”bold”]($133,990)[/hen-ui-text][/hen-ui-text][/hen-ui-list-item] [hen-ui-list-item][hen-ui-text variant=”b4″]Hawaii [hen-ui-text tag=”strong” weight=”bold”]($129,210)[/hen-ui-text][/hen-ui-text][/hen-ui-list-item] [hen-ui-list-item][hen-ui-text variant=”b4″]Oregon [hen-ui-text tag=”strong” weight=”bold”]($110,940)[/hen-ui-text][/hen-ui-text][/hen-ui-list-item] [hen-ui-list-item][hen-ui-text variant=”b4″]Alaska [hen-ui-text tag=”strong” weight=”bold”]($106,410)[/hen-ui-text][/hen-ui-text][/hen-ui-list-item] [hen-ui-list-item][hen-ui-text variant=”b4″]Nevada [hen-ui-text tag=”strong” weight=”bold”]($96,210)[/hen-ui-text][/hen-ui-text][/hen-ui-list-item][/hen-ui-list][hen-ui-text variant=”b4″]Among the [hen-ui-text tag=”strong” weight=”bold”]lowest-paying states[/hen-ui-text] for RNs are:[/hen-ui-text][hen-ui-list variant=”unordered” bullet-style=”bullet”] [hen-ui-list-item][hen-ui-text variant=”b4″]Alabama [hen-ui-text tag=”strong” weight=”bold”]($65,900)[/hen-ui-text][/hen-ui-text][/hen-ui-list-item] [hen-ui-list-item][hen-ui-text variant=”b4″]South Dakota [hen-ui-text tag=”strong” weight=”bold”]($67,030)[/hen-ui-text][/hen-ui-text][/hen-ui-list-item] [hen-ui-list-item][hen-ui-text variant=”b4″]Mississippi [hen-ui-text tag=”strong” weight=”bold”]($69,370)[/hen-ui-text][/hen-ui-text][/hen-ui-list-item] [hen-ui-list-item][hen-ui-text variant=”b4″]Florida [hen-ui-text tag=”strong” weight=”bold”]($80,960)[/hen-ui-text][/hen-ui-text][/hen-ui-list-item] [hen-ui-list-item][hen-ui-text variant=”b4″]New Hampshire [hen-ui-text tag=”strong” weight=”bold”]($86,620)[/hen-ui-text][/hen-ui-text][/hen-ui-list-item][/hen-ui-list][hen-ui-text variant=”b4″]You might immediately notice that there is a stark contrast between the median annual RN salary in California ($133,990) compared to Alabama ($65,900). That said, California’s cost-of-living index score is 112.5, compared to Alabama’s 87.8. The cost-of-living index measures the amount you need to spend to reach a certain standard of living, where 100 equals the national average.[/hen-ui-text][hen-ui-heading variant=”h2″]The Highest-Paying States Adjusted for Cost of Living[/hen-ui-heading][hen-ui-text variant=”b4″]When we adjust for cost of living, RN salaries by state and their relative earning power change. In the BLS data, salaries in the top 10 states were adjusted for cost of living according to the cost-of-living index, or regional price parity (RPP), by state from the [hen-ui-link href=”https://www.bea.gov/news/2023/personal-consumption-expenditures-state-2022″ target=”_blank”]Bureau of Economic Analysis[/hen-ui-link] (BEA).[/hen-ui-text][hen-ui-text variant=”b4″]RPP demonstrates how far your dollars go in each state. Even after adjusting for cost of living, the top 10 states remain relatively the same, with two significant changes: Nevada and Delaware rank within the top 10, New Jersey falls to 13th position, and Massachusetts falls to 14th position after adjusting.[/hen-ui-text][hen-ui-table][hen-ui-table-caption]The Highest-Paying States for RNs Adjusted for Cost of Living[/hen-ui-table-caption][hen-ui-table-header][hen-ui-table-row][hen-ui-table-head scope=”col”]Rank[/hen-ui-table-head][hen-ui-table-head scope=”col”]State[/hen-ui-table-head][hen-ui-table-head scope=”col”]Cost of Living Index Where 100 = U.S.[/hen-ui-table-head][hen-ui-table-head scope=”col”]Salary Adjusted for Cost of Living[/hen-ui-table-head][/hen-ui-table-row][/hen-ui-table-header][hen-ui-table-body][hen-ui-table-row][hen-ui-table-cell data-title=”Rank”]1[/hen-ui-table-cell][hen-ui-table-cell data-title=”State”]California[/hen-ui-table-cell][hen-ui-table-cell data-title=”Cost of Living Index Where 100 = U.S.”]112.5[/hen-ui-table-cell][hen-ui-table-cell data-title=”Salary Adjusted for Cost of Living”]$119,102[/hen-ui-table-cell][/hen-ui-table-row][hen-ui-table-row][hen-ui-table-cell data-title=”Rank”]2[/hen-ui-table-cell][hen-ui-table-cell data-title=”State”]Hawaii[/hen-ui-table-cell][hen-ui-table-cell data-title=”Cost of Living Index Where 100 = U.S.”]110.8[/hen-ui-table-cell][hen-ui-table-cell data-title=”Salary Adjusted for Cost of Living”]$116,616[/hen-ui-table-cell][/hen-ui-table-row][hen-ui-table-row][hen-ui-table-cell data-title=”Rank”]3[/hen-ui-table-cell][hen-ui-table-cell data-title=”State”]Alaska[/hen-ui-table-cell][hen-ui-table-cell data-title=”Cost of Living Index Where 100 = U.S.”]102[/hen-ui-table-cell][hen-ui-table-cell data-title=”Salary Adjusted for Cost of Living”]$104,324[/hen-ui-table-cell][/hen-ui-table-row][hen-ui-table-row][hen-ui-table-cell data-title=”Rank”]4[/hen-ui-table-cell][hen-ui-table-cell data-title=”State”]Oregon[/hen-ui-table-cell][hen-ui-table-cell data-title=”Cost of Living Index Where 100 = U.S.”]106.6[/hen-ui-table-cell][hen-ui-table-cell data-title=”Salary Adjusted for Cost of Living”]$104,071[/hen-ui-table-cell][/hen-ui-table-row][hen-ui-table-row][hen-ui-table-cell data-title=”Rank”]5[/hen-ui-table-cell][hen-ui-table-cell data-title=”State”]Nevada[/hen-ui-table-cell][hen-ui-table-cell data-title=”Cost of Living Index Where 100 = U.S.”]96.4[/hen-ui-table-cell][hen-ui-table-cell data-title=”Salary Adjusted for Cost of Living”]$99,803[/hen-ui-table-cell][/hen-ui-table-row][hen-ui-table-row][hen-ui-table-cell data-title=”Rank”]6[/hen-ui-table-cell][hen-ui-table-cell data-title=”State”]Minnesota[/hen-ui-table-cell][hen-ui-table-cell data-title=”Cost of Living Index Where 100 = U.S.”]97.7[/hen-ui-table-cell][hen-ui-table-cell data-title=”Salary Adjusted for Cost of Living”]$99,591[/hen-ui-table-cell][/hen-ui-table-row][hen-ui-table-row][hen-ui-table-cell data-title=”Rank”]7[/hen-ui-table-cell][hen-ui-table-cell data-title=”State”]Washington[/hen-ui-table-cell][hen-ui-table-cell data-title=”Cost of Living Index Where 100 = U.S.”]109.8[/hen-ui-table-cell][hen-ui-table-cell data-title=”Salary Adjusted for Cost of Living”]$98,106[/hen-ui-table-cell][/hen-ui-table-row][hen-ui-table-row][hen-ui-table-cell data-title=”Rank”]8[/hen-ui-table-cell][hen-ui-table-cell data-title=”State”]New York[/hen-ui-table-cell][hen-ui-table-cell data-title=”Cost of Living Index Where 100 = U.S.”]107.6[/hen-ui-table-cell][hen-ui-table-cell data-title=”Salary Adjusted for Cost of Living”]$97,184[/hen-ui-table-cell][/hen-ui-table-row][hen-ui-table-row][hen-ui-table-cell data-title=”Rank”]9[/hen-ui-table-cell][hen-ui-table-cell data-title=”State”]Delaware[/hen-ui-table-cell][hen-ui-table-cell data-title=”Cost of Living Index Where 100 = U.S.”]98[/hen-ui-table-cell][hen-ui-table-cell data-title=”Salary Adjusted for Cost of Living”]$95,102[/hen-ui-table-cell][/hen-ui-table-row][hen-ui-table-row][hen-ui-table-cell data-title=”Rank”]10[/hen-ui-table-cell][hen-ui-table-cell data-title=”State”]Connecticut[/hen-ui-table-cell][hen-ui-table-cell data-title=”Cost of Living Index Where 100 = U.S.”]106.4[/hen-ui-table-cell][hen-ui-table-cell data-title=”Salary Adjusted for Cost of Living”]$94,568[/hen-ui-table-cell][/hen-ui-table-row][/hen-ui-table-body][/hen-ui-table]Source: BLS and [hen-ui-link href=”https://www.bea.gov/” target=”_blank”]BEA[/hen-ui-link], 2023[hen-ui-heading variant=”h3″]Top and Bottom States by Change in Nursing Salary[/hen-ui-heading][hen-ui-text variant=”b4″]Awareness of significant increases or decreases in median annual RN salaries can help you choose the right location for your career. No economist can truly tell us where salaries might be heading, but trends are worth paying attention to.[/hen-ui-text][hen-ui-card variant=”background-white” border=”stroke” padding=”lg”] [hen-ui-card-content] [hen-ui-text variant=”b4″ class=”font-heading font-bold text-xl text-primary-900″]States With the Largest Percentage Increase in Median Annual Salary[/hen-ui-text][hen-ui-list variant=”unordered” bullet-style=”bullet”] [hen-ui-list-item][hen-ui-text variant=”b4″]Oklahoma: [hen-ui-text tag=”strong” weight=”bold”]26.68%[/hen-ui-text][/hen-ui-text][/hen-ui-list-item] [hen-ui-list-item][hen-ui-text variant=”b4″]West Virginia: [hen-ui-text tag=”strong” weight=”bold”]26.19%[/hen-ui-text][/hen-ui-text][/hen-ui-list-item] [hen-ui-list-item][hen-ui-text variant=”b4″]Indiana: [hen-ui-text tag=”strong” weight=”bold”]25.85%[/hen-ui-text][/hen-ui-text][/hen-ui-list-item] [hen-ui-list-item][hen-ui-text variant=”b4″]Missouri: [hen-ui-text tag=”strong” weight=”bold”]24.66%[/hen-ui-text][/hen-ui-text][/hen-ui-list-item] [hen-ui-list-item][hen-ui-text variant=”b4″]Kentucky: [hen-ui-text tag=”strong” weight=”bold”]24.57%[/hen-ui-text][/hen-ui-text][/hen-ui-list-item][/hen-ui-list] [/hen-ui-card-content][/hen-ui-card][hen-ui-text variant=”b4″]Oklahoma, West Virginia, Indiana, Missouri, and Kentucky had the largest increases in median annual salary for RNs. Demand may drive changes, as can increased employer competition due to regional nursing shortages. Changing demographics, such as an aging population caused by an influx of retired people moving from other states, can also impact salary variants.[/hen-ui-text][hen-ui-text variant=”b4″]If you’re a nurse considering relocation, explore the area’s wages, cost of living, job opportunities, and economic projections. Take into consideration the quality of schools if you have children, access to nature, air and water quality, the level of sprawl and growth, crime, and other statistics. After all, a higher salary will not improve your life if you don’t like the overall environment and location.[/hen-ui-text][hen-ui-heading variant=”h2″]Complete List of States by 2023 Registered Nursing Salary[/hen-ui-heading][hen-ui-text variant=”b4″]If you’re looking for more information on RN salaries in all 50 states and the District of Columbia, the following table is a helpful resource that includes adjustments for cost of living. Find your state, a state where you previously lived, or perhaps a state where you might wish to relocate, and compare the data to your personal economic reality, desired lifestyle, and what that state has to offer you and your family.[/hen-ui-text][hen-ui-text variant=”b4″ class=”text-sm”]Source: BLS and [hen-ui-link href=”https://www.bea.gov/” target=”_blank”]BEA[/hen-ui-link], 2023[/hen-ui-text][hen-ui-accordion variant=”no-background”] [hen-ui-accordion-item title=”Sources”] [hen-ui-text-stack gap=”sm”] [hen-ui-list variant=”unordered” bullet-style=”bullet”] [hen-ui-list-item][hen-ui-text variant=”b4″][hen-ui-link href=”https://www.bea.gov/news/2023/personal-consumption-expenditures-state-2022″ target=”_blank”]https://www.bea.gov/news/2023/personal-consumption-expenditures-state-2022[/hen-ui-link][/hen-ui-text][/hen-ui-list-item] [hen-ui-list-item][hen-ui-text variant=”b4″][hen-ui-link href=”https://nursejournal.org/resources/childcare-assistance-resources-for-nurses/”]https://nursejournal.org/resources/childcare-assistance-resources-for-nurses/[/hen-ui-link][/hen-ui-text][/hen-ui-list-item] [hen-ui-list-item][hen-ui-text variant=”b4″]https://www.bls.gov/oes/current/oes291141.htm[/hen-ui-text][/hen-ui-list-item] [hen-ui-list-item][hen-ui-text variant=”b4″]https://www.bls.gov/oes/current/oes291171.htm[/hen-ui-text][/hen-ui-list-item][/hen-ui-list] [/hen-ui-text-stack] [/hen-ui-accordion-item][/hen-ui-accordion]


 Credit: Courtney Hale / Getty Images[hen-ui-card variant=”background-white” border=”stroke”][hen-ui-flex direction=”column” gap=”lg”][hen-ui-heading variant=”h2″]Key Takeaways[/hen-ui-heading][hen-ui-list variant=”unordered” bullet-style=”check” marker-color=”secondary”] [hen-ui-list-item][hen-ui-text variant=”b4″]Alabama reports the lowest annual median salary for RNs at $65,900 in 2023.[/hen-ui-text][/hen-ui-list-item] [hen-ui-list-item][hen-ui-text variant=”b4″]Cost-of-living adjusted salaries place California nurses’ earnings at $119,102, the highest in the country.[/hen-ui-text][/hen-ui-list-item] [hen-ui-list-item][hen-ui-text variant=”b4″]Nurses can compare state salary and living-cost data to target high-paying regions or negotiate competitive pay aligned with local economics.[/hen-ui-text][/hen-ui-list-item][/hen-ui-list][/hen-ui-flex][/hen-ui-card][hen-ui-text variant=”b4″]Registered nurses (RNs) are dedicated professionals serving citizens across the lifespan. Beyond the satisfaction of doing such honorable work, nurses deserve to [hen-ui-link href=”https://nursejournal.org/registered-nursing/rn-salary/”]earn a salary[/hen-ui-link] equal to their knowledge, skill, and experience.[/hen-ui-text][hen-ui-text variant=”b4″]Keeping track of changes in national and local nurse salary data can help professionals make good career choices in terms of where to live and work. It may also provide insights to help you [hen-ui-link href=”https://nursejournal.org/ask-a-nurse/how-to-negotiate-a-higher-salary/”]negotiate higher pay[/hen-ui-link].[/hen-ui-text][hen-ui-text variant=”b4″]This article covers newly released data from the U.S. Bureau of Labor Statistics (BLS) as of May 2023. Read on to discover the latest nurse salary data and which states pay nurses the most.[/hen-ui-text]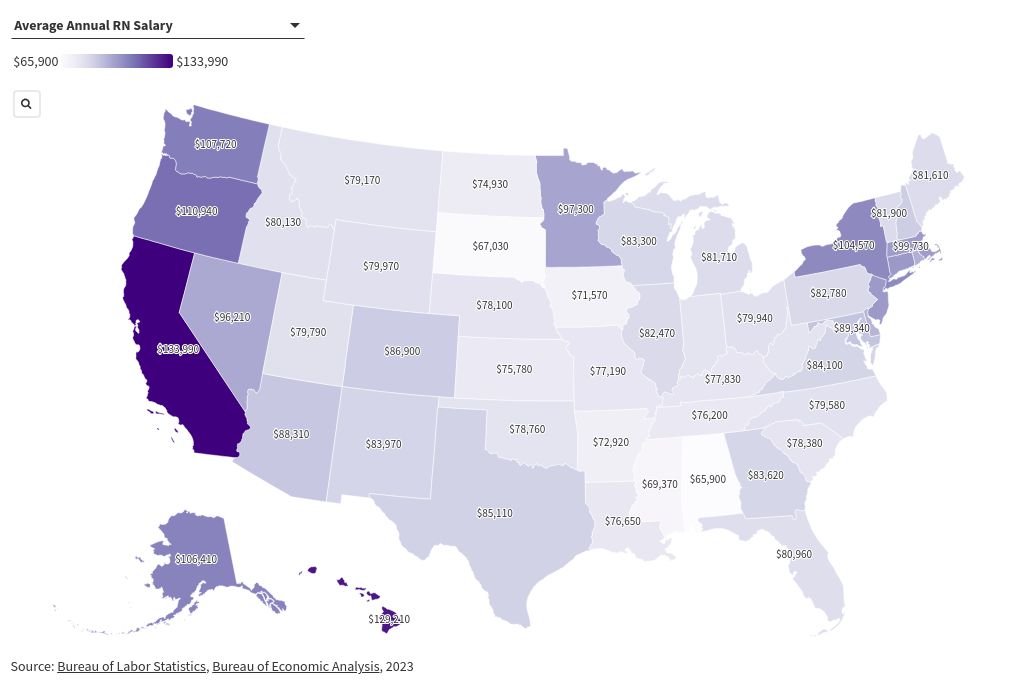
 [hen-ui-heading variant=”h2″ class=”py-4 my-0 text-center border-b md:pb-8 md:border-none”]Related Pages[/hen-ui-heading][hen-ui-article-row variant=”3-col” ids=”47047,33951,67743″][/hen-ui-article-row]